
Every session replay tool ships a list of frustration signals: rage clicks, dead clicks, error clicks, a few more. Vision does too, with eleven of them. They are useful, and they share one limit: each one is a rule that someone wrote because they already suspected the problem. The friction nobody suspected never gets a rule, so it never shows up.
This post is about the other half: finding the patterns no one thought to look for, by letting the sessions themselves say what separates the visitors who leave from the ones who complete.
What the research says
Inferring frustration from behaviour is not new, and the evidence is solid enough to build on.
- The cursor gives emotion away. In a study published in MIS Quarterly in 2017, Hibbeln, Jenkins and Valacich showed that frustrated users move the mouse over longer and slower paths. In one experiment, that signal alone identified the people who had used the frustrating version of a site about 82 % of the time (summary).
- Logs beat sensors. Feild, Allan and Jones predicted searcher frustration from interaction logs more accurately than from physical sensors (SIGIR 2010). Google researchers found the same kind of signals when search gets hard: questions instead of keywords, longer queries mid-session, more time on the results page (Google Research).
- Patterns can be discovered, not only defined. Lagun and colleagues mined recurring cursor-movement motifs without hand-written rules, and used them to predict what users found relevant (WSDM 2014).
Commercial tools mostly stop at the first step. Microsoft Clarity flags rage clicks, dead clicks, excessive scrolling and quick backs. Fullstory adds error clicks and the thrashed cursor. Contentsquare lists looping navigation, repeated form submissions and slow responses. All of them are predefined.
Leaving is not failing
The obvious approach, comparing sessions that convert with sessions that do not, has a flaw. Many visitors leave because they found what they came for: the opening hours, the programme, the answer in the FAQ. Search researchers call it good abandonment. Counting those visits as failures would bury every real signal under people who were perfectly happy.
So Vision starts from intent. A funnel says what the site wants visitors to do, and its first step says who showed the intent to do it. Only sessions that reached the first step are compared:
- Left: started the funnel and never reached its last step.
- Completed: reached the last step. Everything they did after it is cut, so we compare what happened before the decision.
How the discovery works
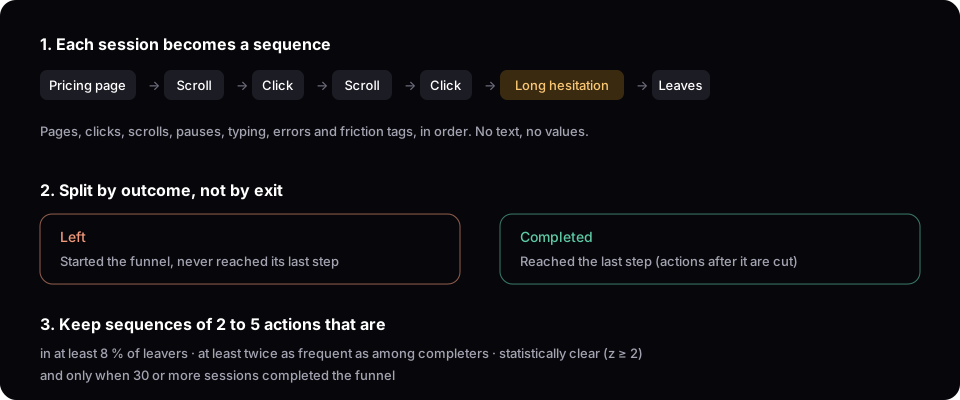
Each session becomes a short sequence of actions: the page, clicks, scrolls, pauses, typing, errors and the friction tags Vision already computes. There is no page text and no typed value in it, so it works on sites where all text is masked.
Vision then takes the last twelve actions before the visitor left (or before they completed) and counts every sequence of two to five actions. A sequence becomes a pattern only when it is:
- present in at least 8 % of the sessions that left,
- at least twice as frequent among them as among the sessions that completed,
- statistically clear (a two-proportion z-score of 2 or more),
- found on a funnel that at least 30 sessions completed.
Overlapping sequences count as one finding, and the five strongest are kept. The analysis runs every Monday on the last 30 days.
What it found on a live site
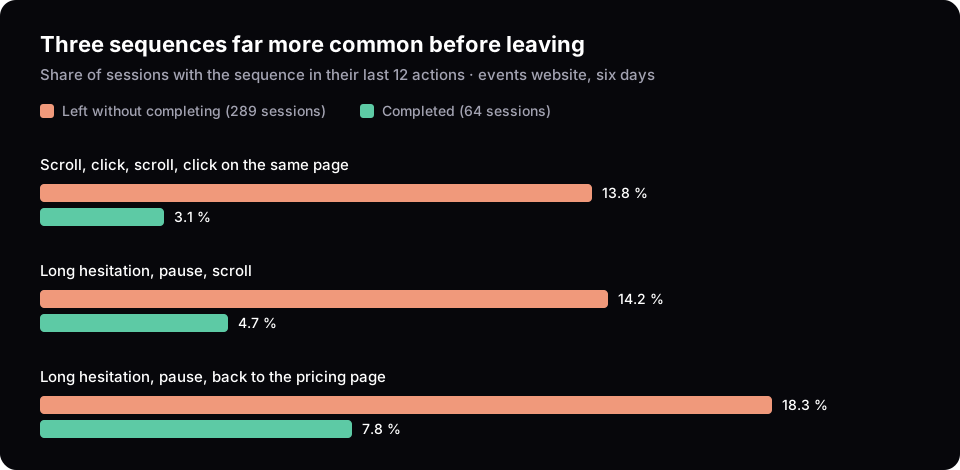
We ran it on an events website, over six days when registrations could be measured: 353 sessions reached the pricing page, 64 of them went on to the registration form.
| Sequence before leaving | Left | Completed | Ratio |
|---|---|---|---|
| Scroll, click, scroll, click on the same page | 13.8 % | 3.1 % | 3.6× |
| Long hesitation, pause, scroll | 14.2 % | 4.7 % | 2.6× |
| Long hesitation, pause, back to the pricing page | 18.3 % | 7.8 % | 2.2× |
The first one is the most telling. Visitors click around the pricing page without moving on, and it happens mostly on mobile: 21.5 % of the mobile visitors who left, against 9.8 % on desktop. No rule-based signal catches it, because no single click is a rage click or a dead click. Watching the sessions points to a comparison table that is hard to read on a small screen. That is a hypothesis for an A/B test, not a conclusion.
The second and third describe hesitation without decision: people re-read, pause, come back to the prices and still leave. They suggest a missing piece of information at the moment of choice.
The first run also caught a problem with our own detection. One sequence, a click followed by typing and an abandoned form, appeared in 11 % of the sessions that left and in none of those that completed. It was not a visitor: a third-party script was filling fifty hidden fields at once on the pricing page, and Vision had counted it as typing. We fixed the rule and rebuilt every session of the last 30 days. Discovery is also a way to audit the rules.
What it does not tell you
A discovered pattern is a lead, not a cause. With 64 completed sessions, a share of 3.1 % rests on two sessions, so the ratios are rough. Vision shows the sessions behind each pattern so you can watch them, and it says nothing until a funnel has at least 30 completions. The useful output is a short list of places to look and hypotheses to test, which is exactly what a team without time to watch hundreds of replays needs.
Where to find it
Discovered patterns appear in each funnel report, under the chart, with the sessions to watch. Agents get them too: the get_funnel_report tool of the Vision API and MCP server returns discovered_patterns with the sequences, shares and example session ids.
Key terms
- Funnel: the ordered steps a site wants visitors to take, for example the pricing page then the registration form.
- Intent: reaching the first step of a funnel.
- Sequence: a run of two to five consecutive actions, such as scroll then click.
- Ratio: how many times more frequent a sequence is among sessions that left than among sessions that completed.
- z-score: a measure of how unlikely a difference between two shares is if it were due to chance; 2 or more is the usual threshold.
- Good abandonment: leaving a site because the visit succeeded, not because it failed.