Overview is the home page of Vision. It summarises the current calendar month for the site selected in the sidebar, and compares it with the same number of days in the previous month.
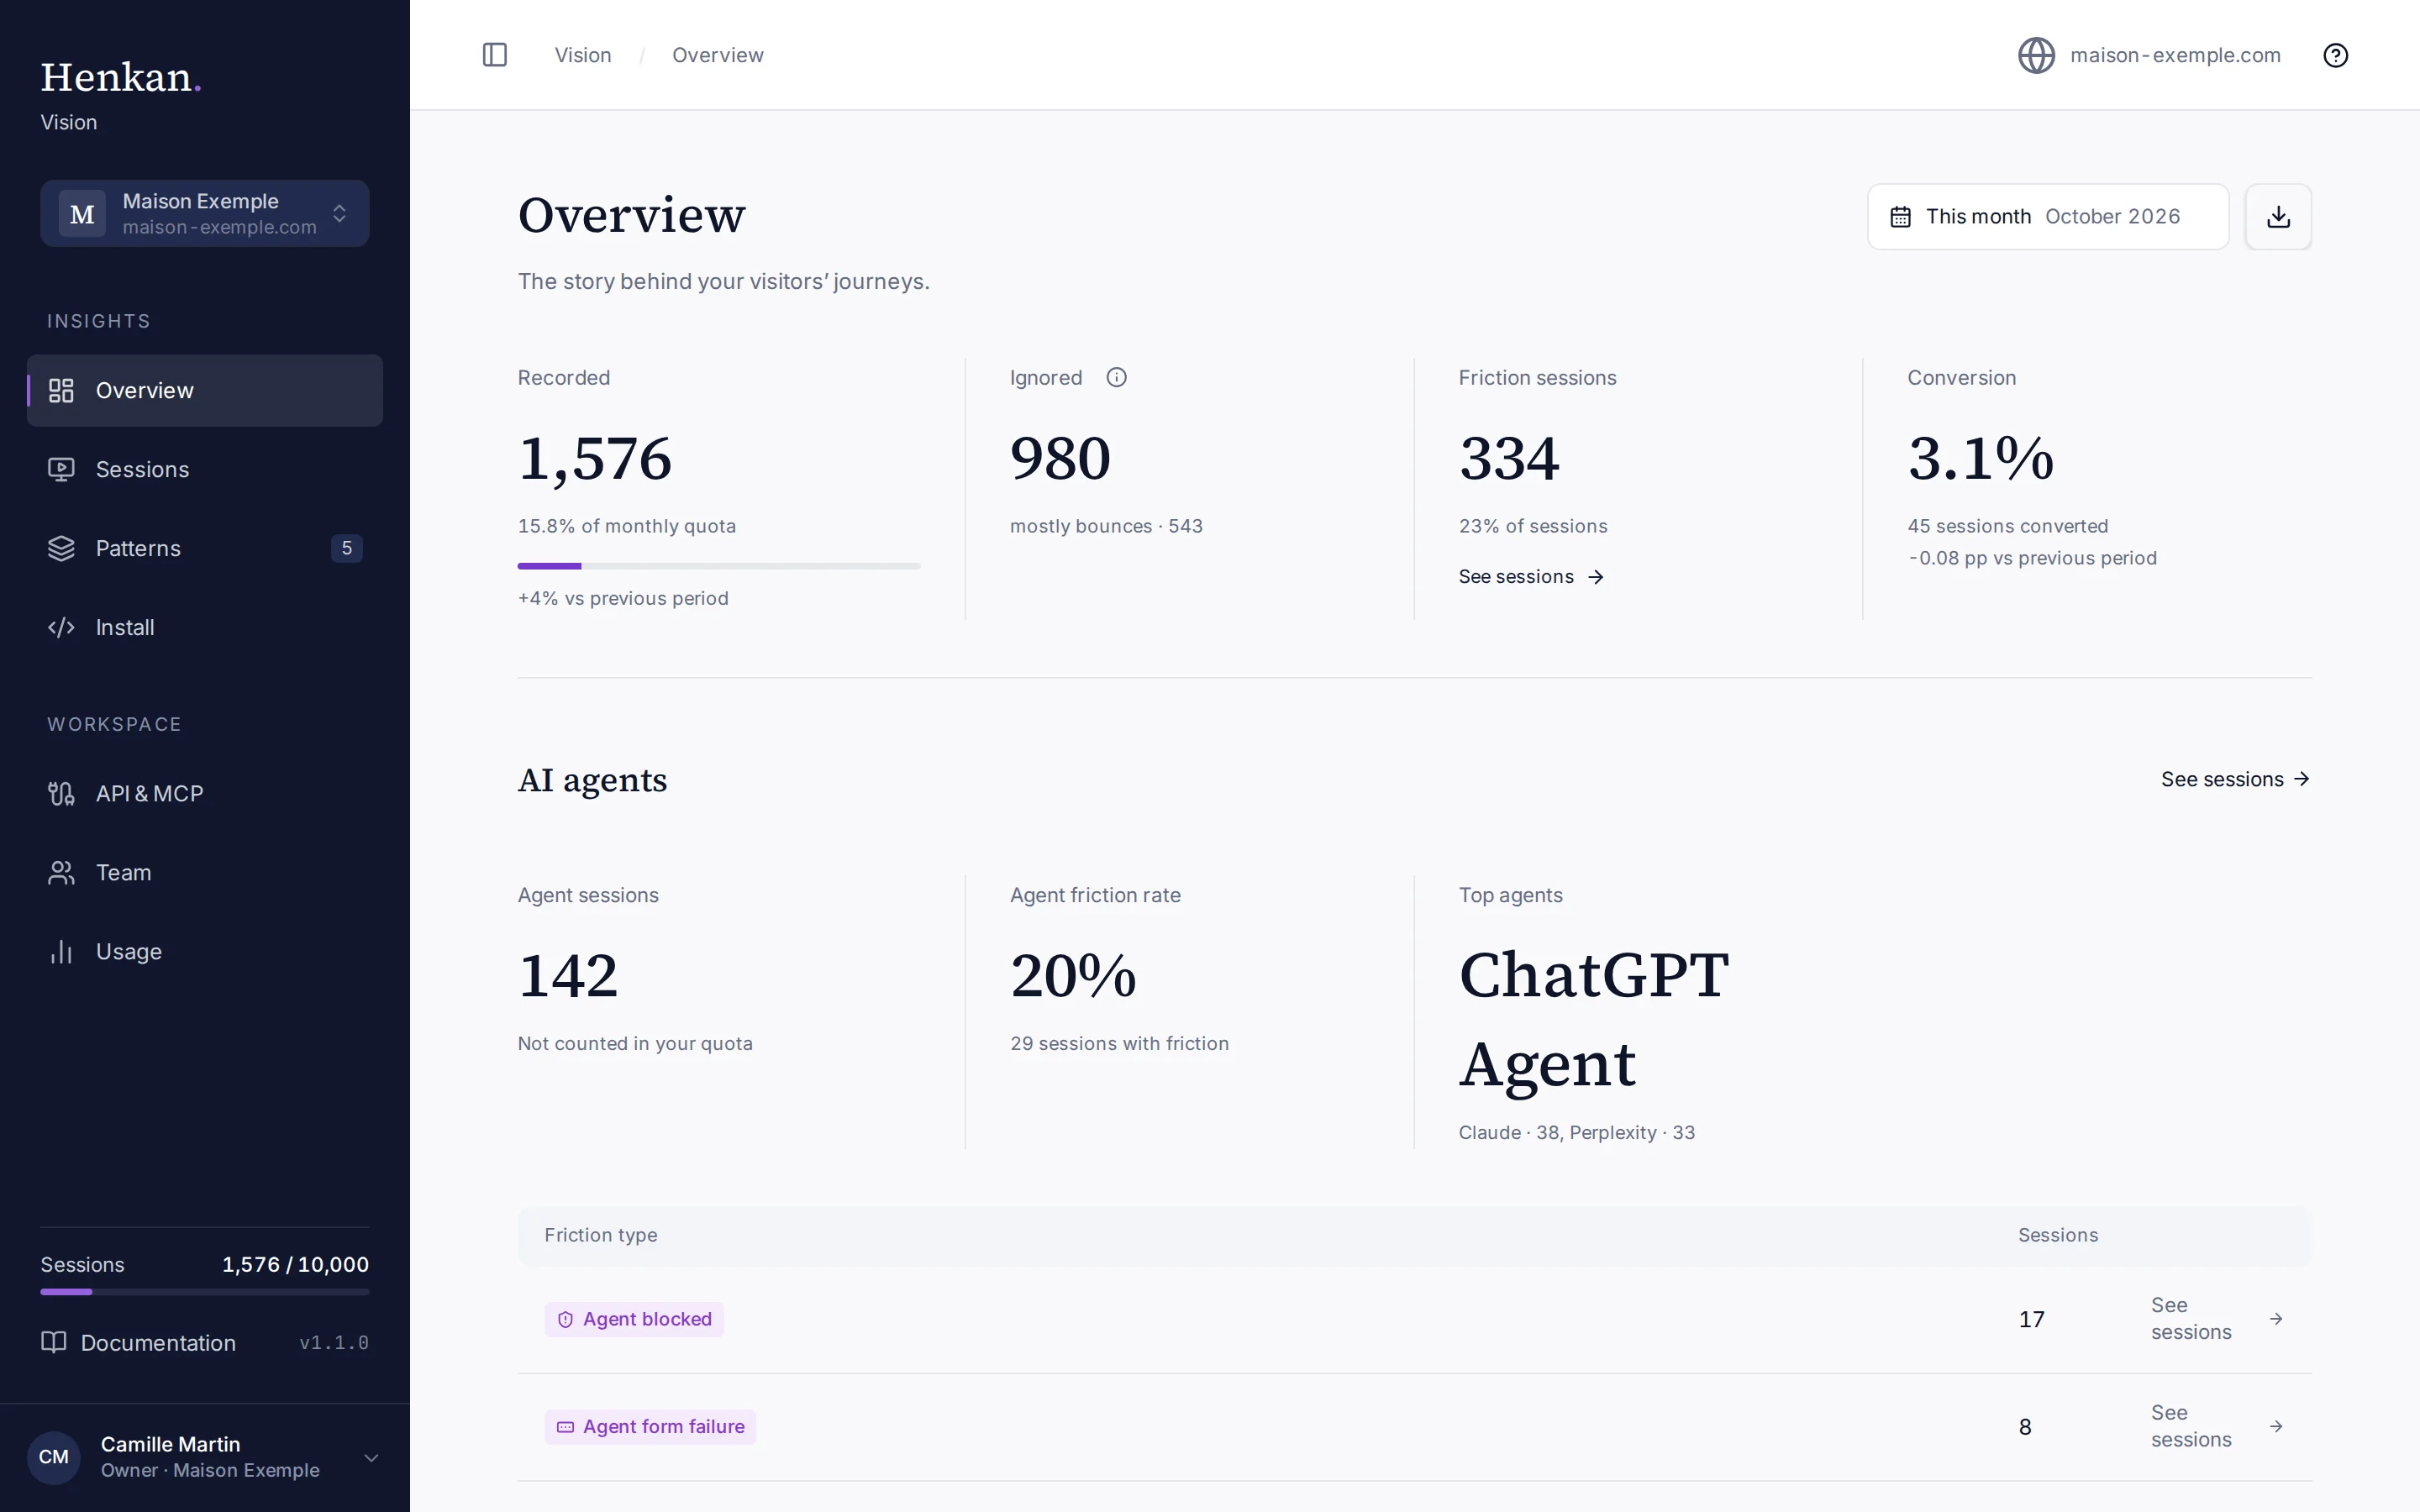
The figures#
| Figure | What it counts |
|---|---|
| Recorded | Human sessions recorded this month across your organisation, against your monthly quota. The arrow compares with the same days last month. |
| Ignored | Visits Vision saw but did not record, with the most common reason underneath. They never count toward your quota. |
| Friction sessions | Sessions on this site with at least one friction tag, and their share of all sessions. |
| Conversion | Sessions that reached an order confirmation page or sent a purchase event, as a share of sessions. The change is shown in percentage points. |
Why visits are ignored#
Select the information icon next to Ignored to see the breakdown.
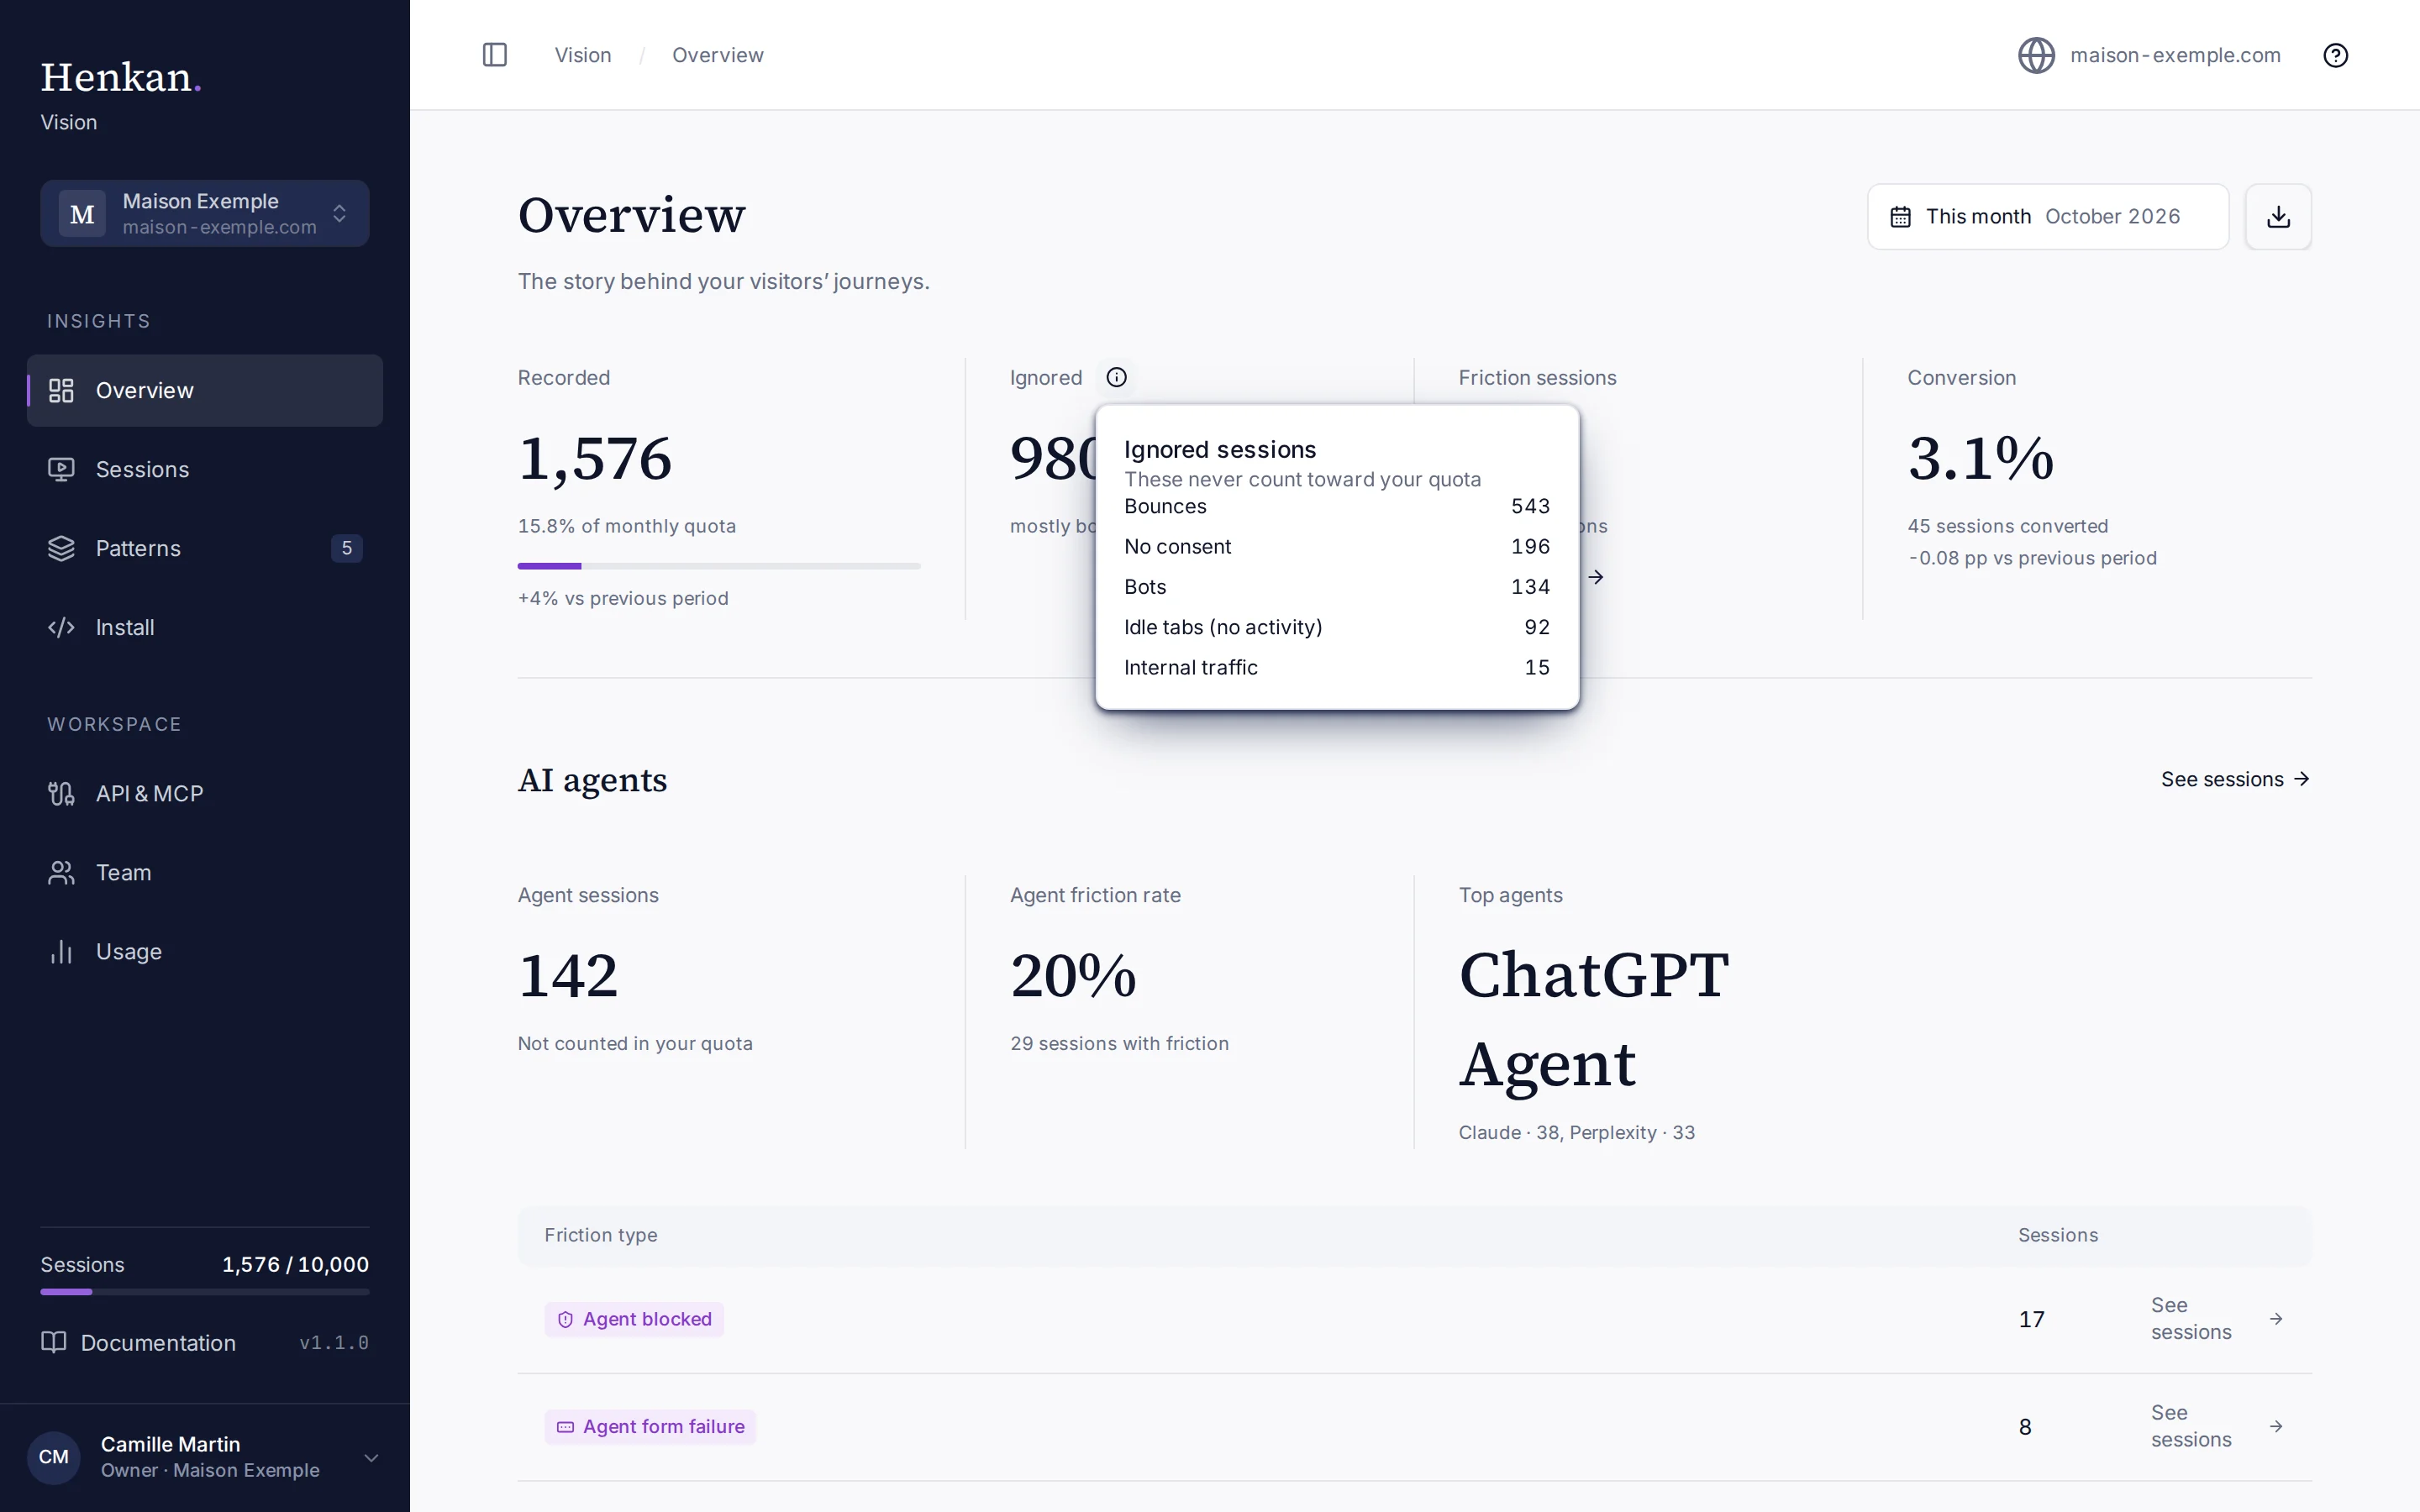
| Reason | Meaning |
|---|---|
| Bounces | Visits that ended before meaningful interaction. |
| Bots | Automated traffic and known crawlers. |
| Internal traffic | Visits from browsers excluded with Exclude my browser. |
| No consent | Visitors who declined analytics consent. |
| Over quota | Sessions received after the monthly allowance was reached. |
| Sampled out | Skipped by 50% sampling near the monthly quota. Cart and checkout pages are always kept. |
| AI agents over cap | AI agent sessions received after the monthly agent cap was reached. |
| Idle tabs (no activity) | Pages left open without any mouse, scroll or keyboard activity. |
AI agents and AI crawlers#
The AI agents block counts visits by AI assistants that browse your site for a person, such as ChatGPT Agent. These sessions are recorded and analysed like human ones, but they never count toward your quota and never mix with human figures. It shows the number of Agent sessions, the Agent friction rate, the Top agents and the agent friction types, each linking to the matching sessions.
The AI crawlers block counts visits by the robots that read your pages for AI search and model training, per vendor (for example OpenAI, Anthropic or Perplexity). Crawlers are counted only: they are never recorded and never count toward your quota. See AI agents and crawlers.
Trends and lists#
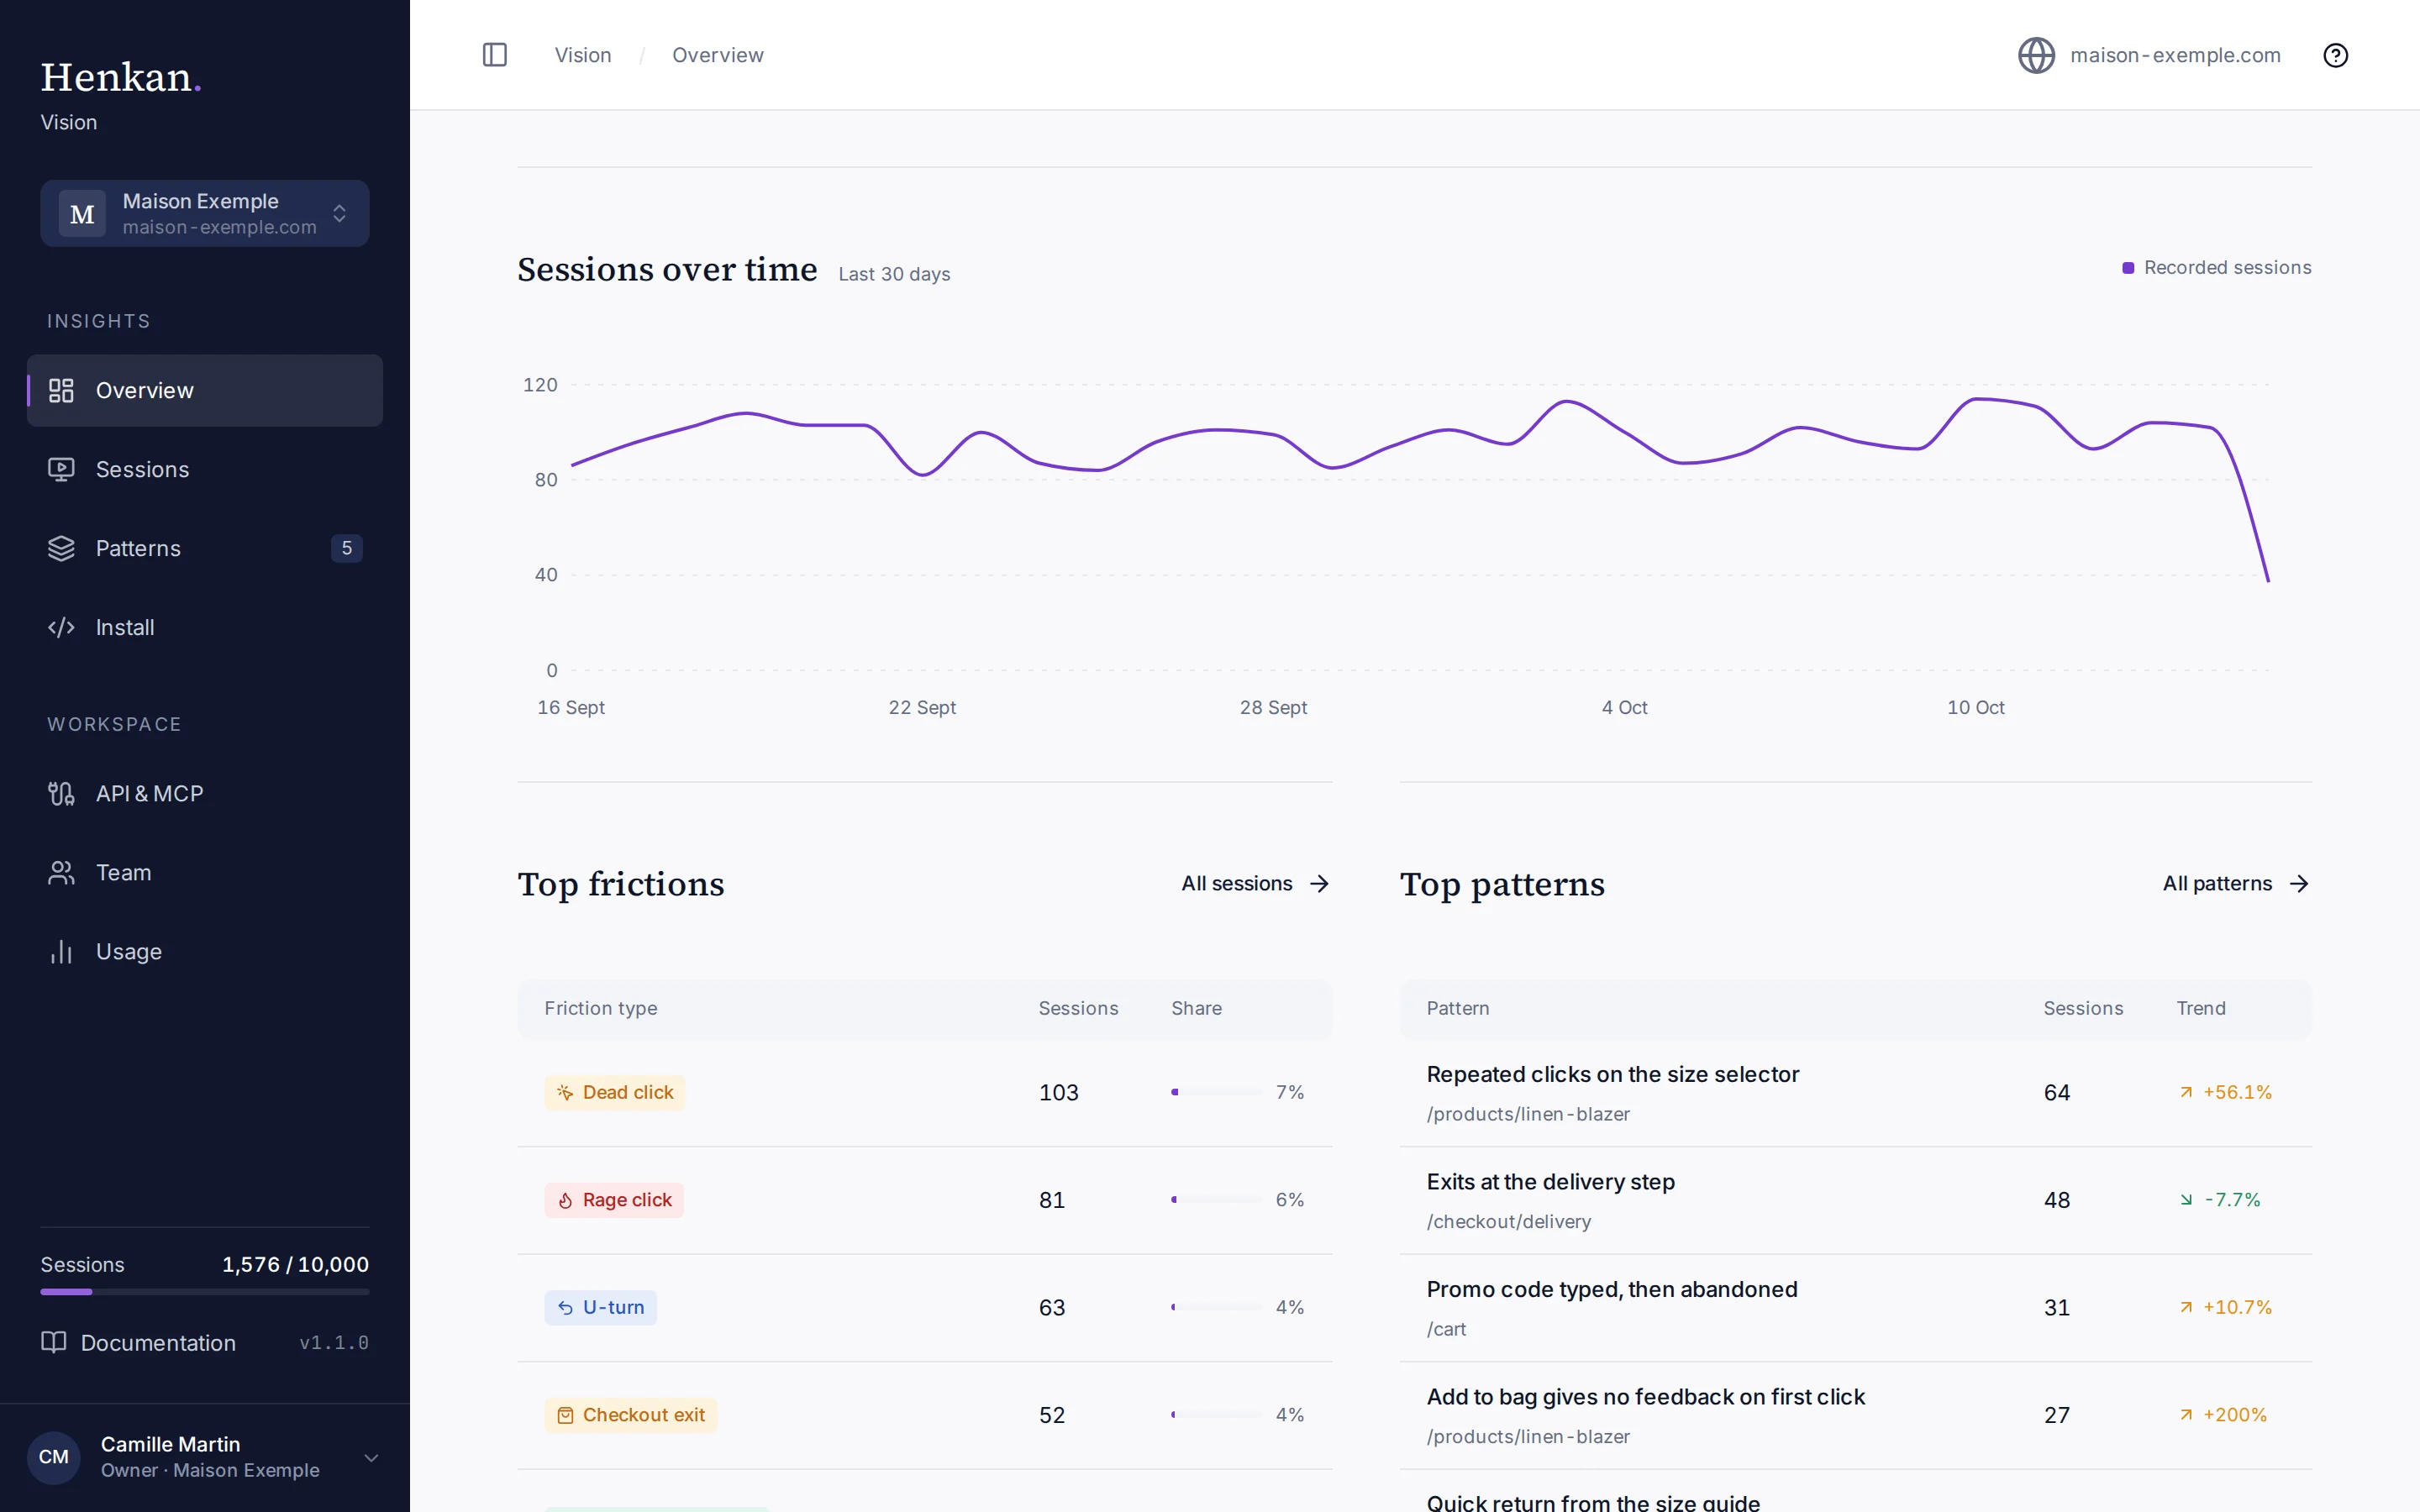
Further down, Overview shows sessions per day over the last 30 days, then the Top frictions and Top patterns of the month. Explore sessions at the bottom opens the full list.
Getting started checklist#
While your organisation is new, owners see a Getting started band with four steps: Install the script, Record your first session, Invite a teammate and Connect an agent. It sits at the top of Overview until the script is installed and the first session is recorded, then moves to the bottom. It disappears when all four are done, or when you dismiss it.
Export the figures#
Select the download icon (Export report) at the top right to download a CSV file of the month's figures for the selected site, one line per day up to today, with the columns date, recorded, friction and converted. While demo data is shown, the file contains the demo figures.
No data yet?#
If the site has no sessions yet, Overview offers Go to Install and See demo sessions. Demo sessions are sample visits from a fashion store, shown read-only; your own data is unchanged. To leave the demo, select Hide demo data or pick your site in the site switcher.