A funnel shows where visitors leave a journey, such as product page, add to bag, cart, checkout and purchase. Because every session is recorded, you can then watch the sessions that left and see why.
Vision counts the human sessions that reach each step in order, within the same session.
All funnels at a glance#
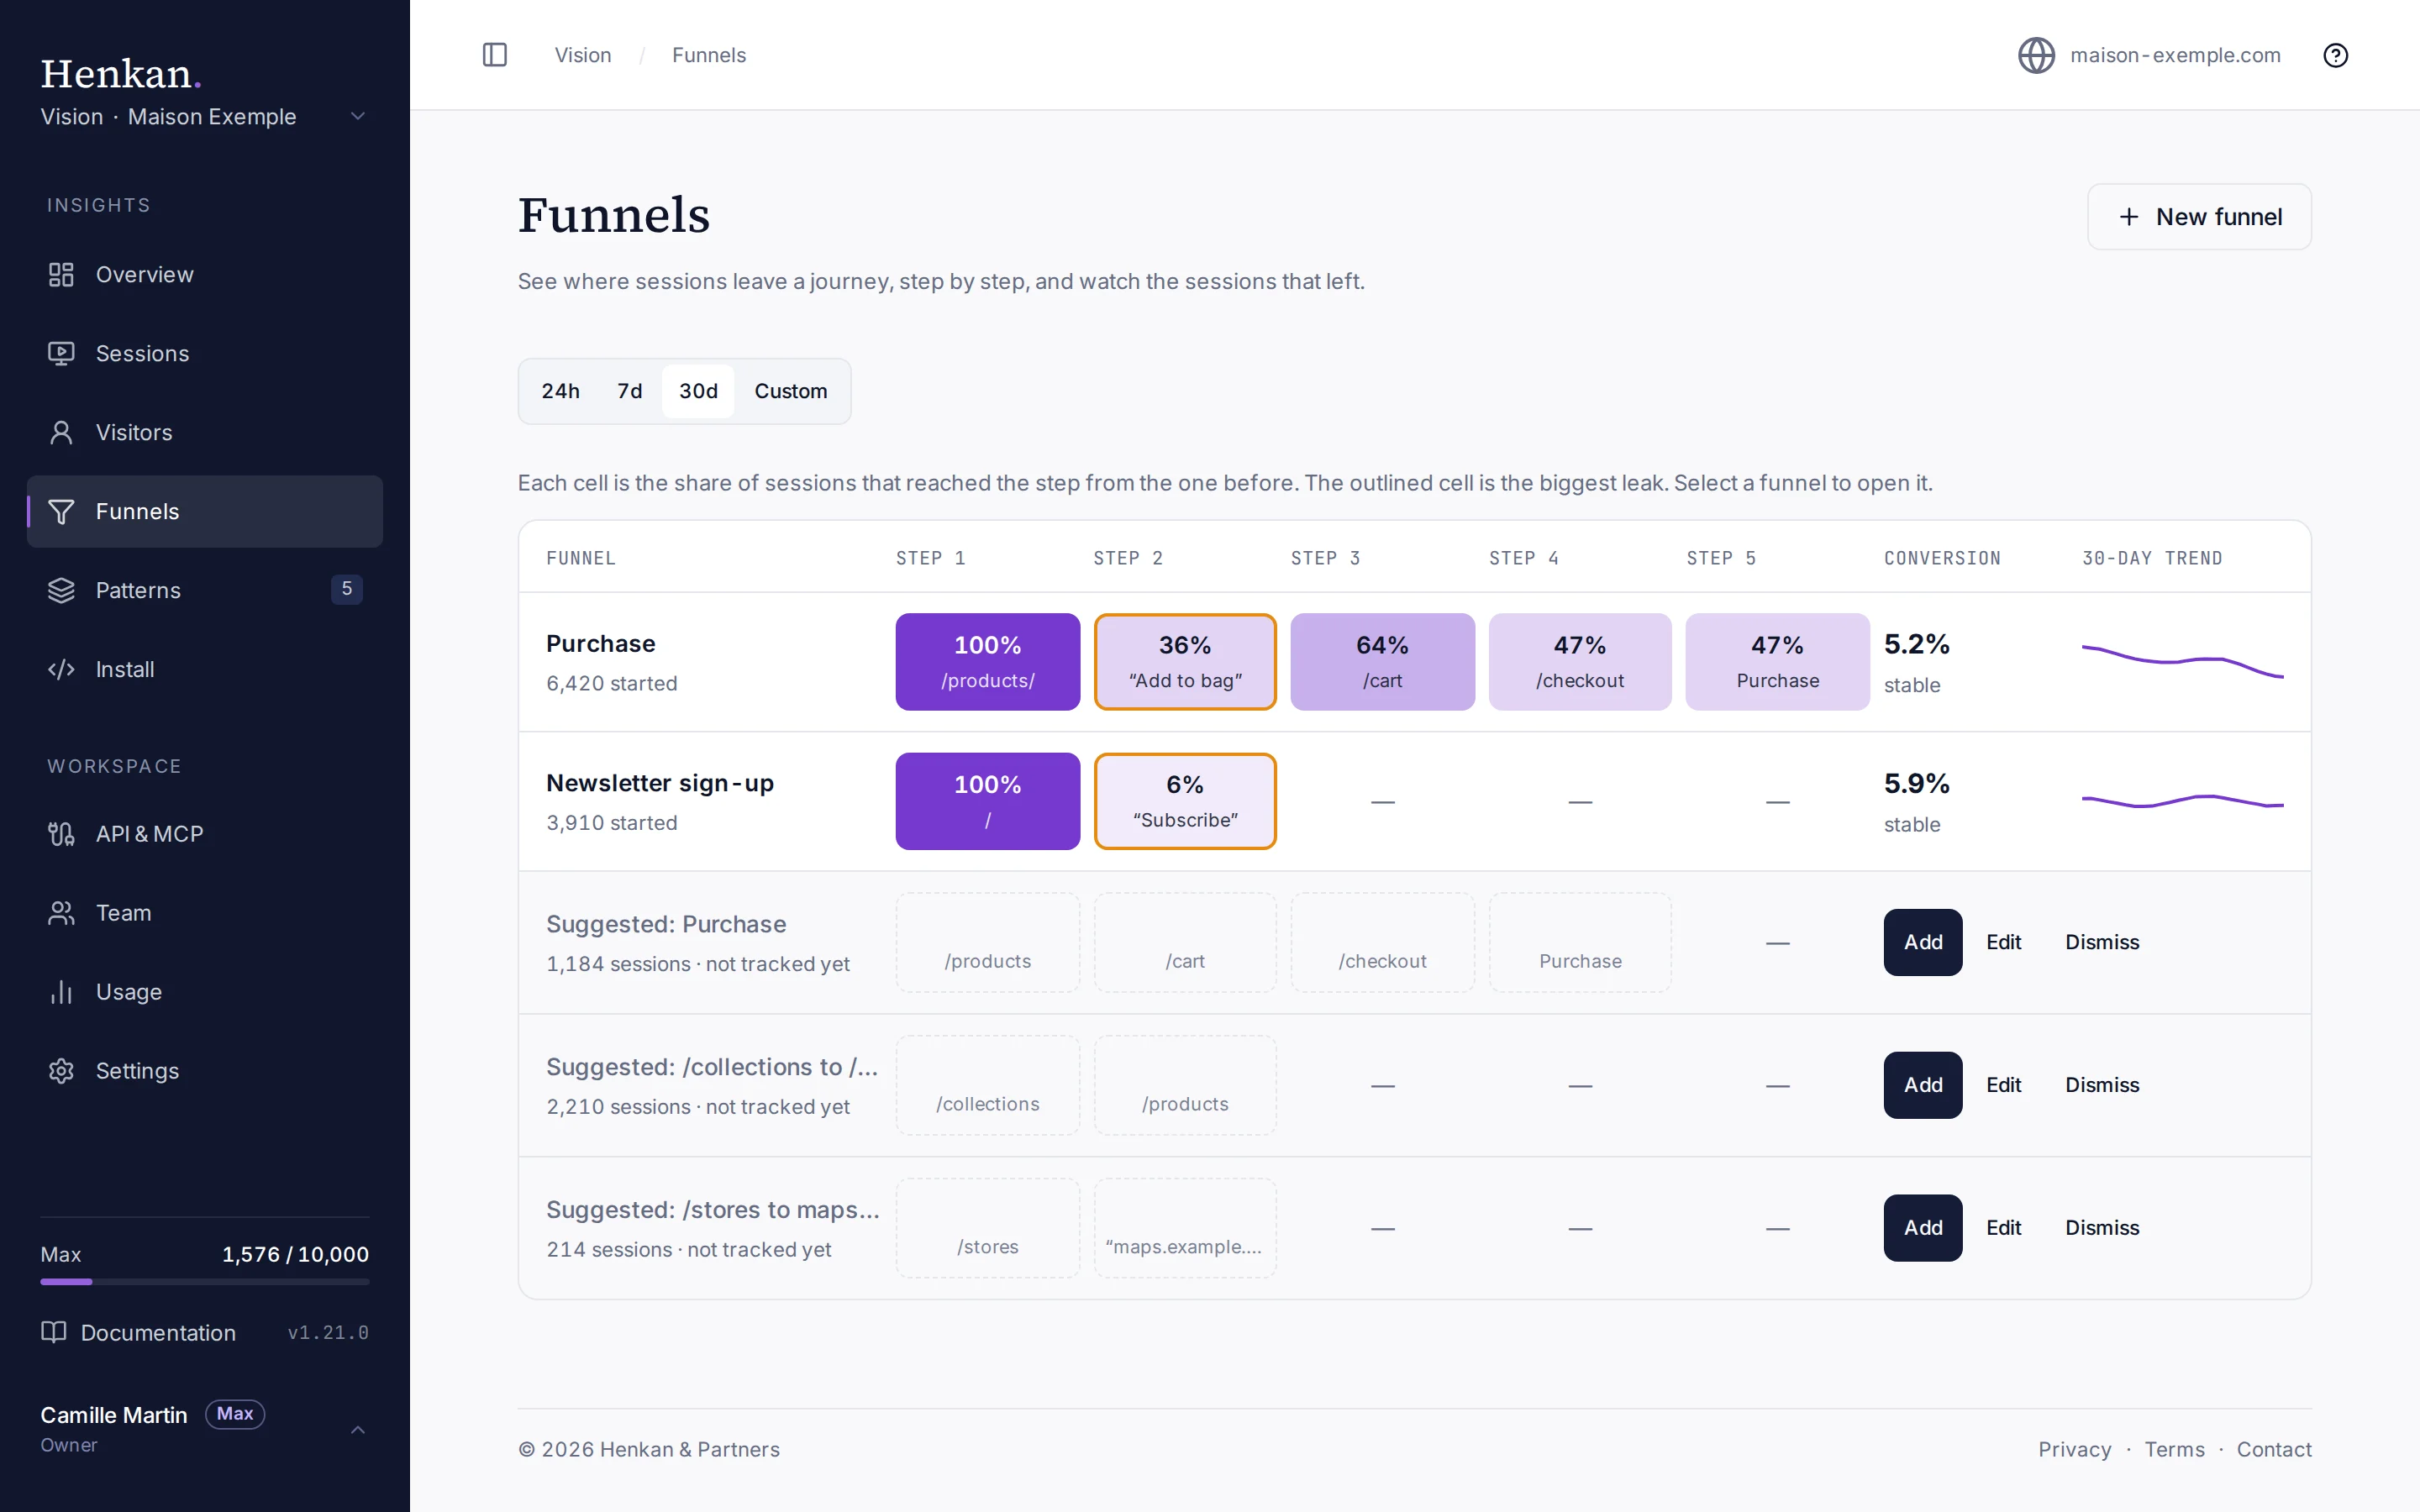
The Funnels page opens on every funnel of the site, one row each. Each cell is the share of sessions that reached that step from the one before, darker when more of them go on. The outlined cell is the funnel's biggest leak: the step with the lowest share. A step with fewer than 30 sessions before it is faded and never called the leak. Then come first-to-last conversion with its change from the previous period of the same length, and a 30-day trend: conversion over a rolling 7-day window across the last 30 days.
Open a funnel#
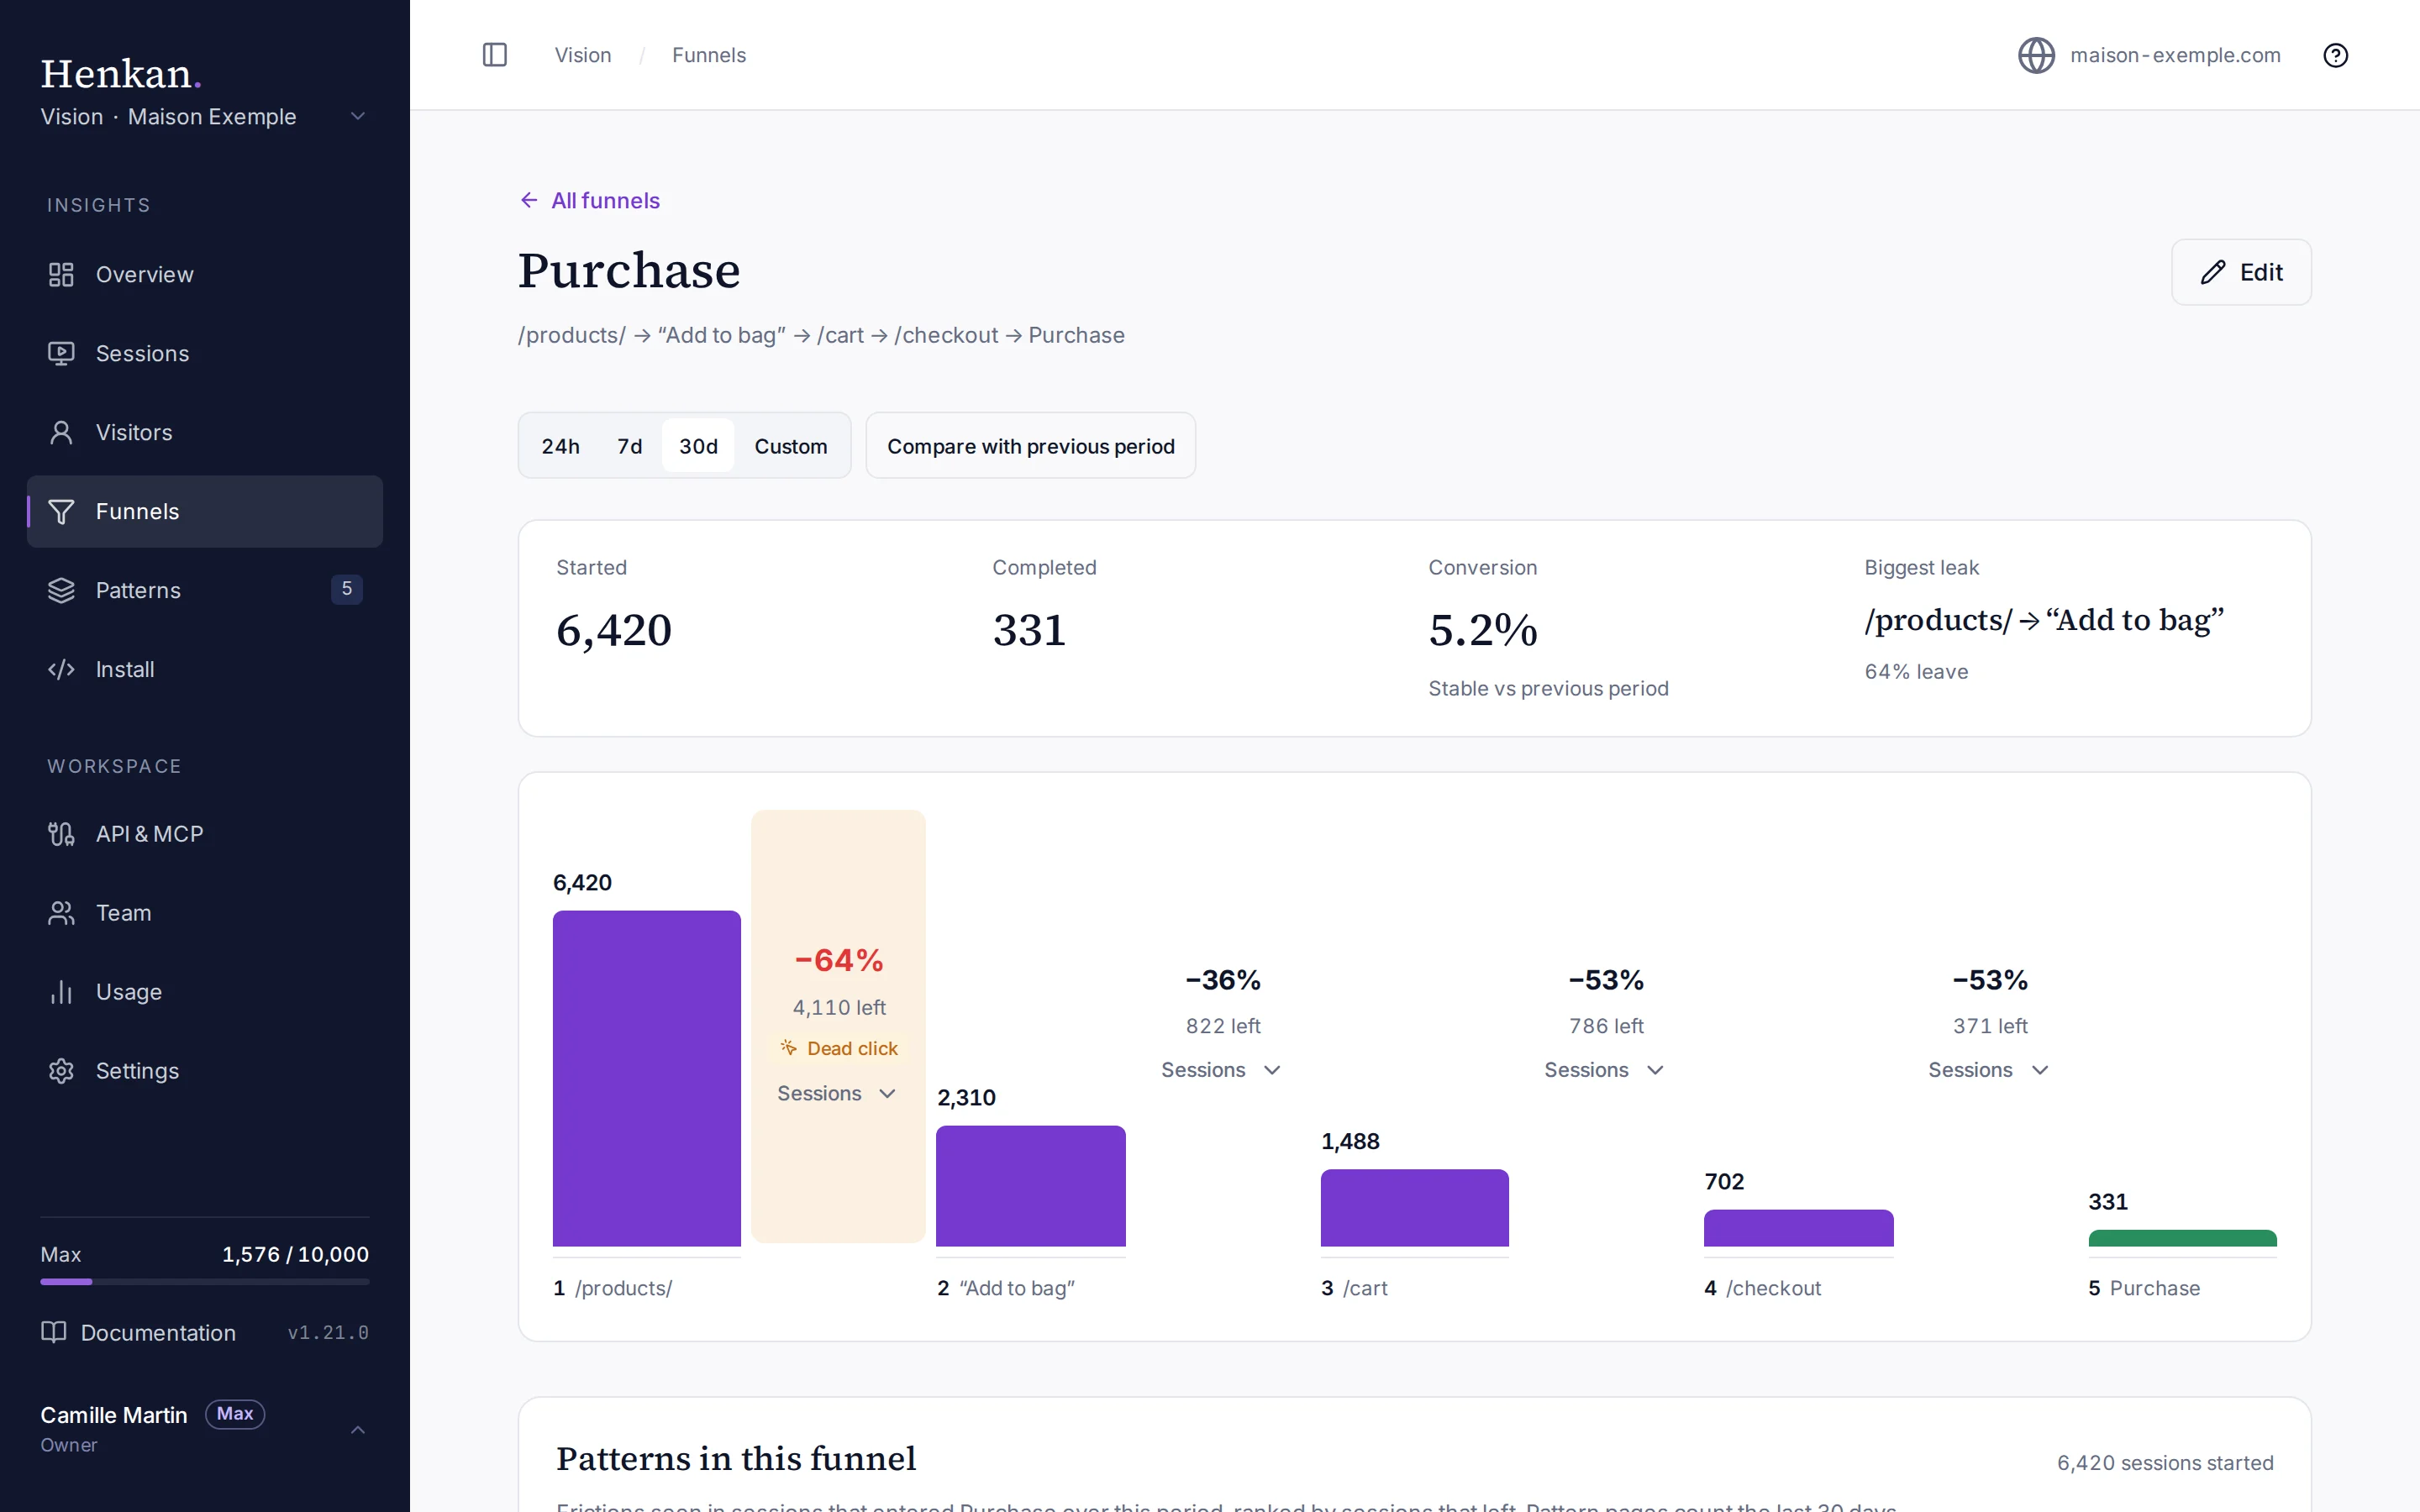
Select a funnel to see it in depth. All funnels brings you back to the list.
Suggested funnels#
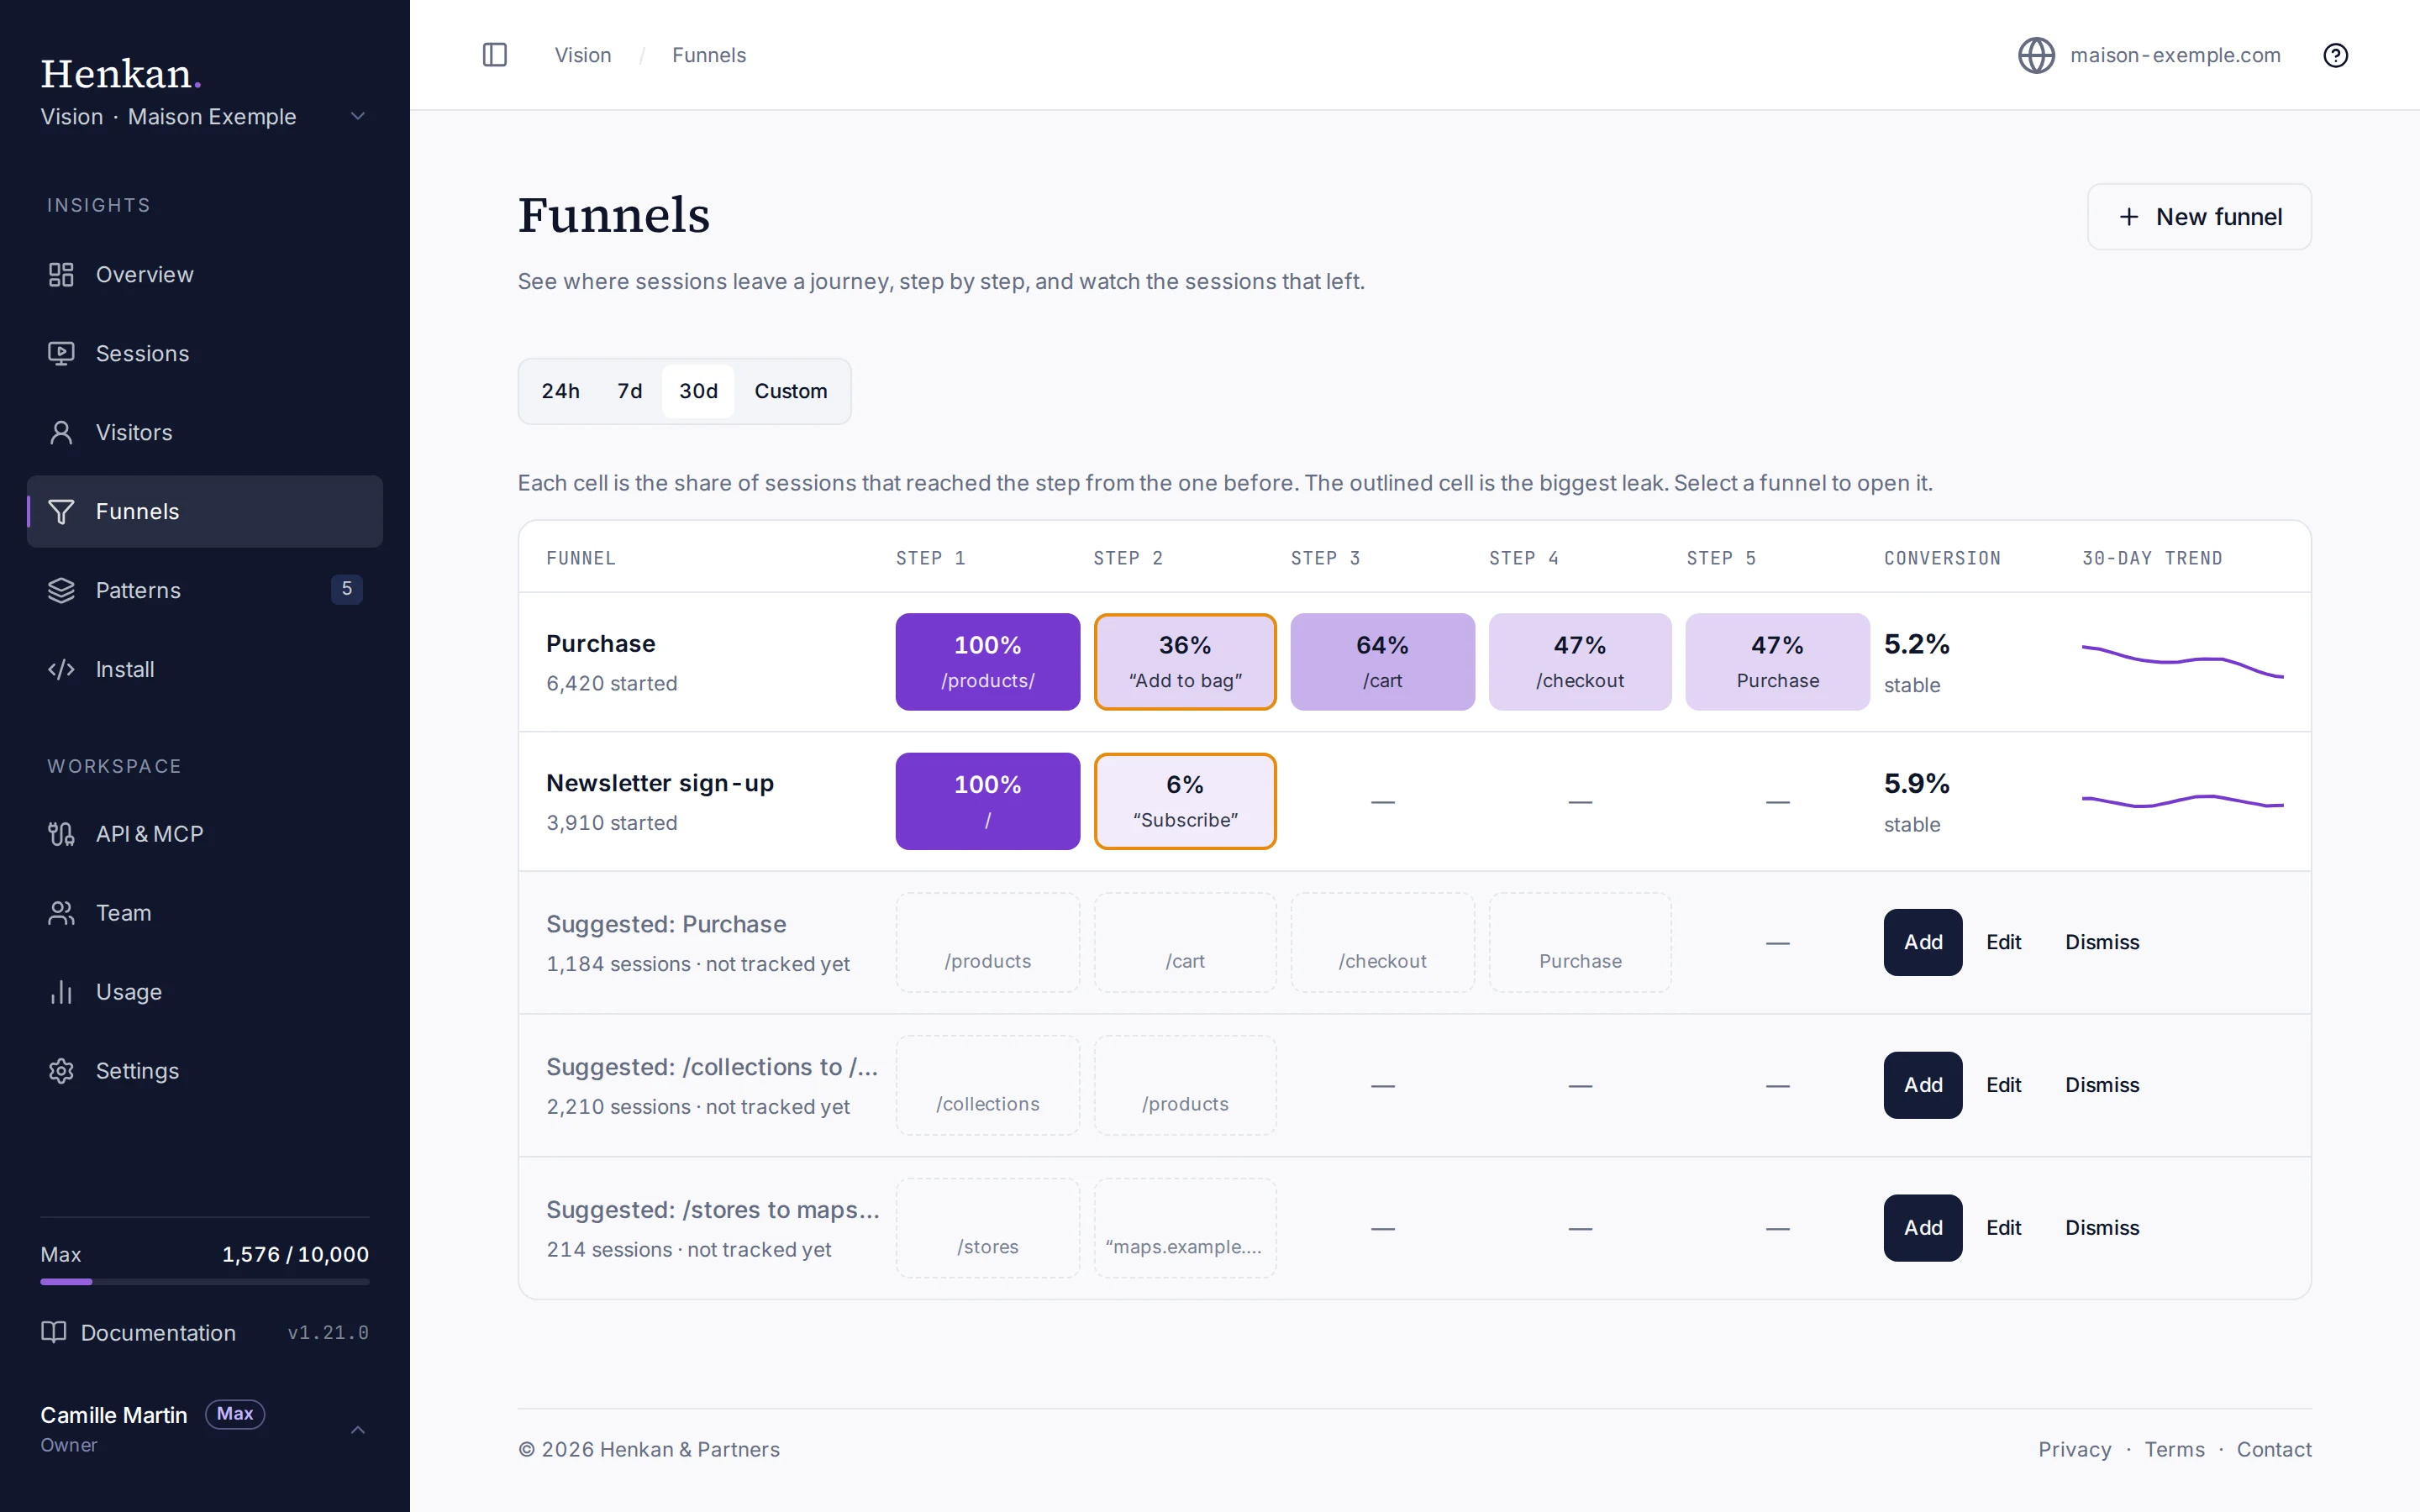
Funnels are never created automatically. Vision suggests up to three journeys as soon as it has enough sessions to find one, based on the last 30 days, and refreshes the suggestions every 6 hours.
- Purchase, when your data layer sends purchase events: the pages at least half of the buyers visit before buying, in their usual order, then the purchase.
- A high-intent page (cart, pricing, booking, registration, contact…) and the page most often seen just before it.
- An outbound link: the most clicked link leaving your site (social networks aside) and the page it is most often clicked from. Useful when the sale happens elsewhere, such as ticketing, booking or sign-up.
Suggestions appear as faded rows at the bottom of the list, with how many sessions reached their first step in 30 days.
- Add. Saves it as is.
- Edit. Opens it in the funnel editor first.
- Dismiss. Hides it for good on this site.
A suggestion identical to an existing funnel is not shown.
Create a funnel#
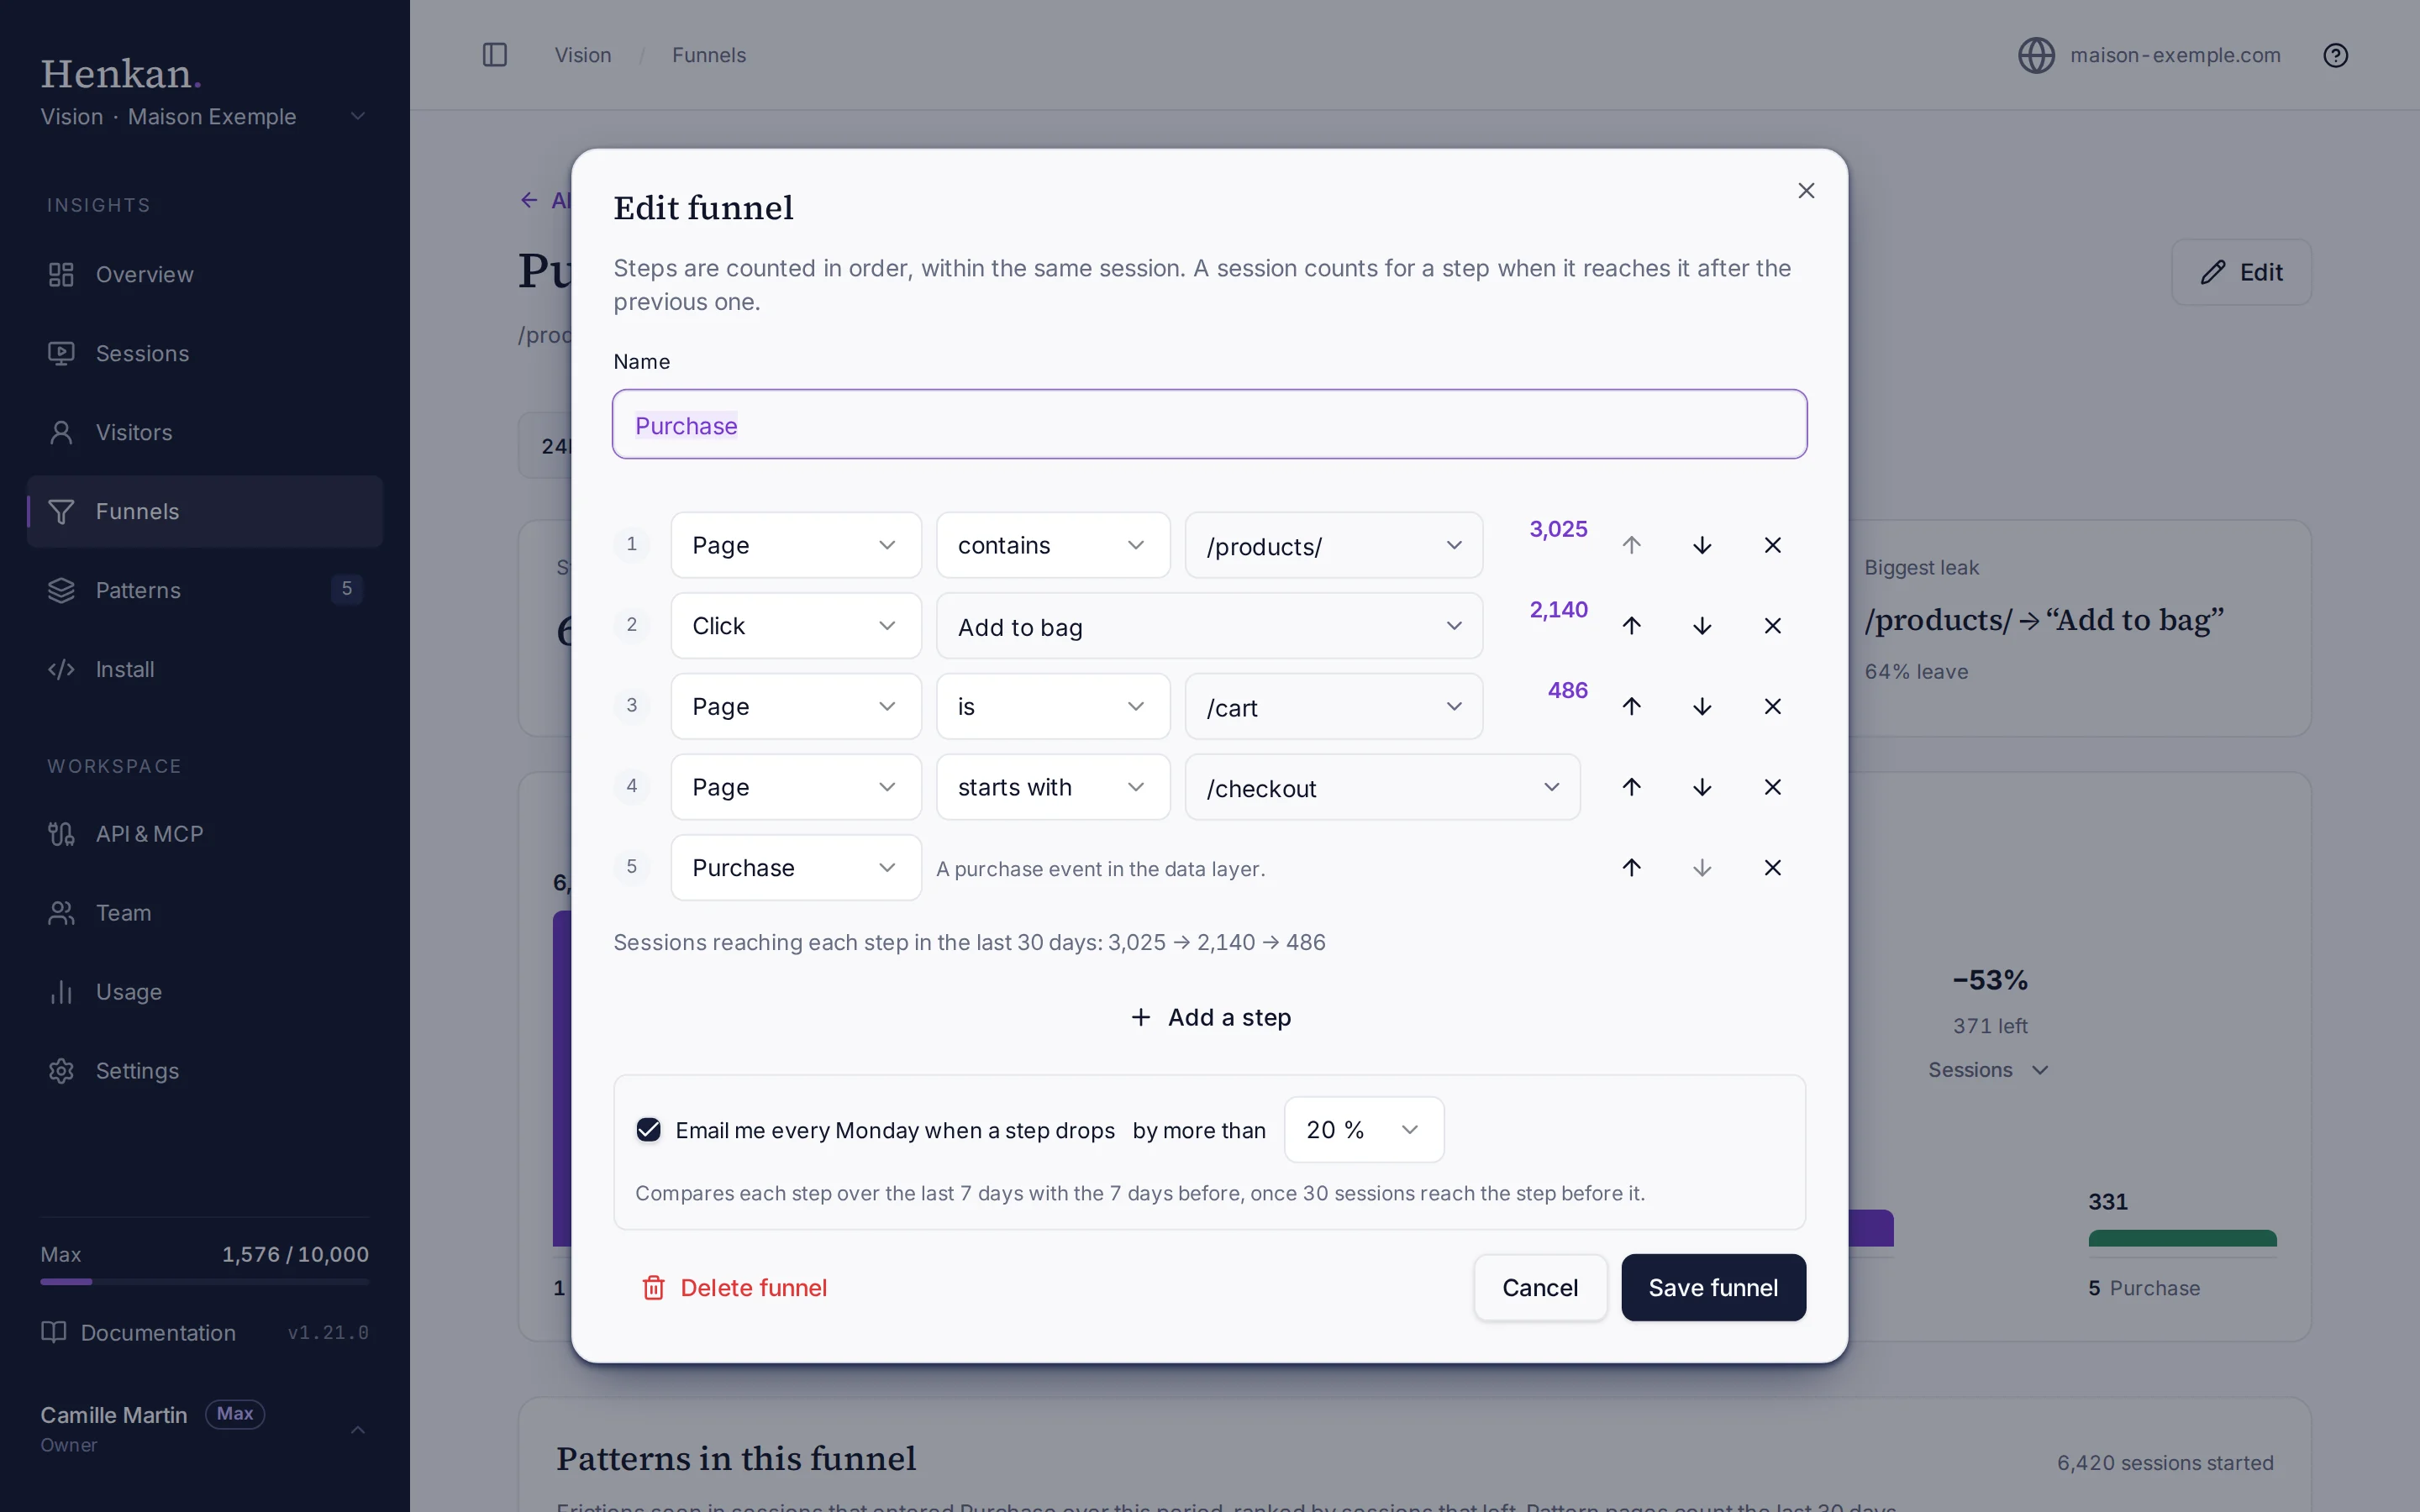
Select New funnel, give it a name and add 2 to 6 steps. Each site can have up to 20 funnels. Only organisation owners can create, edit and delete them.
A page step matches an address that is, starts with or contains the value. Is ignores a trailing slash, so /pricing also matches /pricing/.
You do not need to know your site's addresses by heart:
- Pick a value For page and click steps, the field lists your site's real pages and most clicked buttons and links of the last 30 days, with how many sessions saw each. Page types such as All product pages set starts with for you. Any typed value still works.
- Start from a template A new funnel offers ready-made funnels built from your site's own pages, such as Home to purchase or Cart to purchase.
- Check as you build Each step shows how many sessions of the last 30 days reach it. A step at zero needs another value.
| Step type | Reached when |
|---|---|
| Page | The session views a page whose address is, starts with or contains the text you enter, for example /cart or /products/. |
| Click | The session clicks a button or link whose text contains what you enter, for example Add to bag, or a link whose address contains it, for example /register or tickets.example.com. Not case-sensitive. When your site's texts are masked in recordings, use the link address. |
| Purchase | The session sends a purchase event to the data layer, as for conversions, or a Shopify order arrives for it. |
| Added to cart | Shopify stores: a product added to the cart, side cart drawers included. See Shopify. |
| Reached checkout | Shopify stores: the visitor started Shopify checkout. |
| Data layer value | The session pushed that value for one of your data layer keys, for example loyalty_tier is gold. It filters the sessions without moving the funnel forward in time. |
A session counts for a step only if it reaches it after the previous step. A session that views the cart and then a product page does not count for a product page → cart funnel.
Get an alert when a step drops#
In the funnel's settings, tick Email me every Monday when a step drops and choose a threshold: 10, 20, 30 or 50 %.
Every Monday morning, Vision compares each step's conversion from the step before it over the last 7 days with the 7 days before. When one falls by more than the threshold, you get one email listing those steps. It links to the funnel with the comparison already on.
- The email goes to one person: whoever turned the alert on or last changed its threshold.
- A step is compared only when at least 30 sessions reached the step before it in both weeks, so small numbers do not raise false alarms.
- Turn the alert off by unticking it.
Patterns in this funnel#
Under the steps, Patterns in this funnel lists the patterns met by the sessions that entered the funnel during the selected period, ranked by the number of sessions that left. Its counts follow the selected period, while a pattern's own page always counts the last 30 days, so the two only match when 30 days are selected. Use it to see which frictions to fix first.
| Column | What it shows |
|---|---|
| In funnel | Visits that reached the first step and had the pattern. |
| Left | Those of them that did not reach the last step. Under the pattern's page, most leave after names the step where most of them stopped. |
| Completed vs the rest | Their completion rate, against the funnel's other sessions. |
The label under each rate reads the comparison:
| Label | Meaning |
|---|---|
| Completes less | Clearly fewer of these sessions complete the funnel. |
| Motivated, still leave | Clearly more of them complete: visitors who try hard, yet many still leave. |
| Close to the rest | No clear difference. |
| None completed | Fewer than 15 sessions, none of them completed. |
| Too few to compare | Fewer than 15 sessions. |
A difference counts as clear when it is unlikely to come from chance (a two-proportion test at 95%). A line above the list says where most people left and which pattern to start with. It shows a link, not a cause: watch the replays from the pattern's page before you change the site.
The five patterns with the most sessions that left show first; select Show all for the rest, up to 20.
Split conversion by segment#
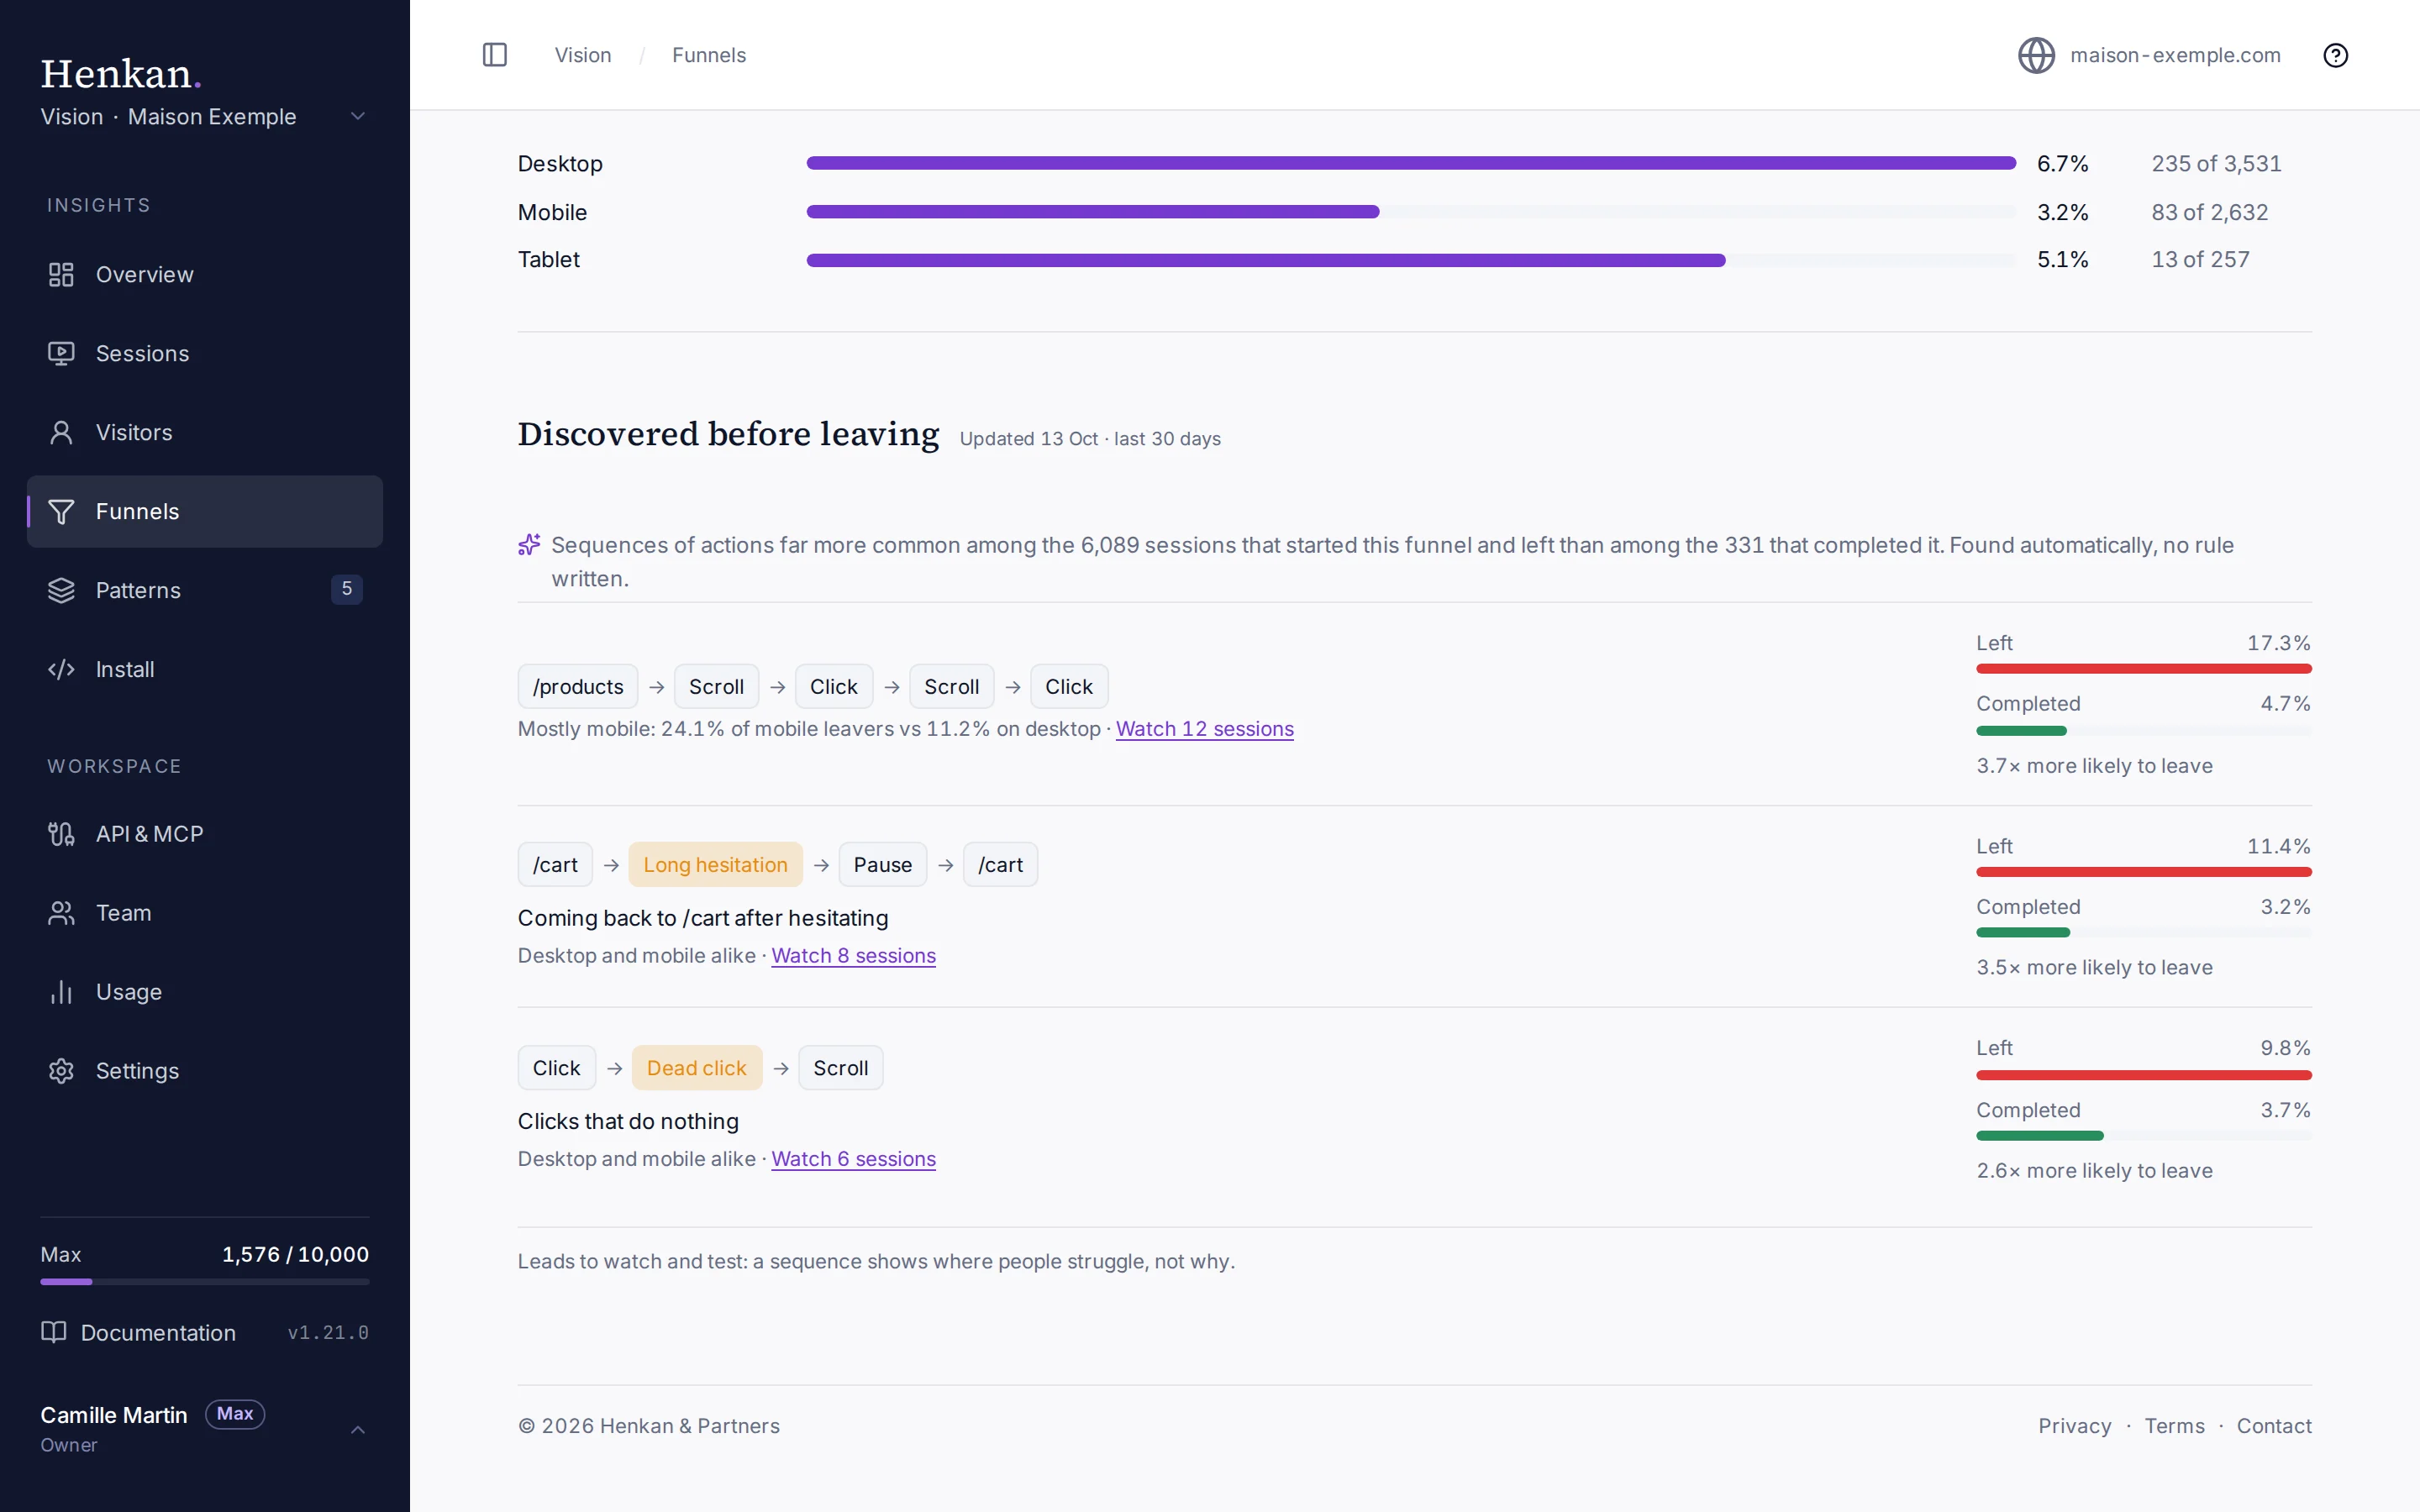
Under the steps, Conversion by segment shows how many sessions went from the first step to the last on desktop, mobile and tablet. Choose a text data layer key in Break down by, such as a customer type, to see the same conversion for its 8 most frequent values.
Discovered before leaving#
This section shows what people did just before they left, compared with people who completed the funnel. It runs every Monday on the last 30 days.
Vision looks at the last 12 actions of every session: pages, clicks, scrolls, pauses, typing, errors and friction tags, never text or typed values. It keeps the sequences of 2 to 5 actions that are:
- in at least 8 % of the sessions that left,
- at least twice as frequent among them as among the sessions that completed,
- statistically clear (two-proportion z-score of 2 or more).
Up to five sequences are shown. Each has the share of both groups, the difference between mobile and desktop when it is marked, and the sessions behind it to watch.
Visitors who never reached the first step are not compared, so people who came only to read are never counted as failures.
Read a funnel#
- Each column is a step, its height scaled to the first step. The number above it counts the sessions that reached it.
- Between two columns, the share and number of sessions that never reached the next step. Sessions lists the newest of them.
- At the biggest leak, the chip is the most frequent friction tag among the sessions that left.
- With Compare with previous period, each leak also shows its change in percentage points.
- The date range works as on Sessions: a preset or any range picked on the calendar. Only human sessions count; AI agents never enter funnels.
Your AI agents can read funnels through the MCP server and the REST API with list_funnels and get_funnel_report, which also returns the discovered sequences.
Plans#
Funnels are included on the POC, Pro and Max plans; funnel alerts on the POC and Max. On other plans the controls stay visible and locked, and funnels you already made stay readable. See Plans.